Basic Flowchart Symbols
Flowcharts are the ideal diagrams for visually representing business processes. For example, if you need to show the flow of a custom-order process through various departments within your organization, you can use a flowchart. This paper provides a visual representation of basic flowchart symbols and their proposed use in communicating the structure of a well-developed web site, as well as their correlation in developing on-line instructional projects. A typical flowchart from older Computer Science textbooks may have the following kinds of symbols:
- Start and end symbols, represented as lozenges, ovals or rounded rectangles, usually containing the word "Start" or "End", or another phrase signaling the start or end of a process, such as "submit enquiry" or "receive product".
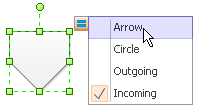
- Arrows, showing what's called "flow of control" in computer science. An arrow coming from one symbol and ending at another symbol signifies flow passes to the symbol the arrow points to.
- Processing steps, represented as rectangles. Examples: "Add 1 to X"; "replace identified part"; "save changes" or similar.
- Input/Output, represented as a parallelogram. Examples: Get X from the user; display X.
- Conditional (or decision), represented as a diamond (rhombus). These typically contain a Yes/No question or True/False test. This symbol is unique in that it has two arrows coming out of it, usually from the bottom point and right point, one corresponding to Yes or True, and one corresponding to No or False. The arrows should always be labeled. More than two arrows can be used, but this is normally a clear indicator that a complex decision is being taken, in which case it may need to be broken-down further, or replaced with the "pre-defined process" symbol.
- A number of other symbols that have less universal currency, such as:
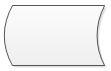
- A Document represented as a rectangle with a wavy base;
- A Manual input represented by a rectangle, with the top irregularly sloping up from left to right. An example would be to signify data-entry from a form;
- A Manual operation represented by a trapezoid with the longest parallel side upmost, to represent an operation or adjustment to process that can only be made manually.
- A Data File represented by a cylinder
Flowcharts may contain other symbols, such as connectors, usually represented as circles, to represent converging paths in the flow chart. Circles will have more than one arrow coming into them but only one going out. Some flow charts may just have an arrow point to another arrow instead. These are useful to represent an iterative process (in Computer Science this is called a loop). A loop may, for example, consist of a connector where control first enters, processing steps, a conditional with one arrow exiting the loop, and one going back to the connector. Off-page connectors are often used to signify a connection to a (part of a) process held on another sheet or screen.
A flowchart is described as "cross-functional" when the page is divided into different "lanes" describing the control of different organizational chart units. A symbol appearing in a particular "lane" is within the control of that organizational unit. This technique allows the analyst to locate the responsibility for performing an action or making a decision correctly, allowing the relationship between different organizational units with responsibility over a single process.
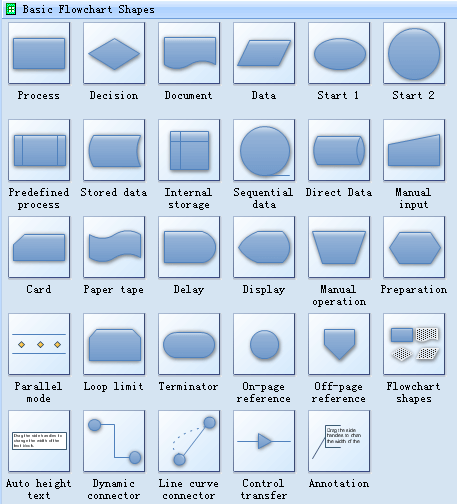
Standard Flowchart Symbols
Flowcharts use special shapes to represent different types of actions or steps in a process. Lines and arrows show the sequence of these steps, and the relationships between them.
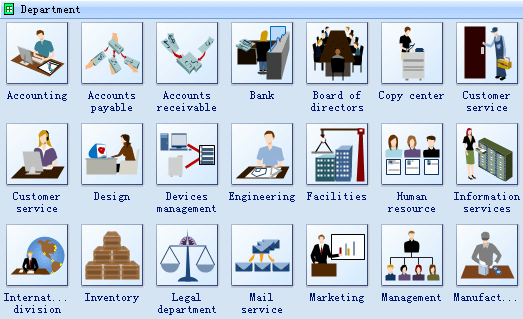
Workflow shapes
Workflow relationships are where work is done by different departments in a fixed sequence. This means that one department needs to finish its job before work can continue in another department. The development and maintenance of these work flow relationships is very important for managers because they are dependant on the preceding areas for his or her own work, and responsible to managers and workers at different stages further down the chain.
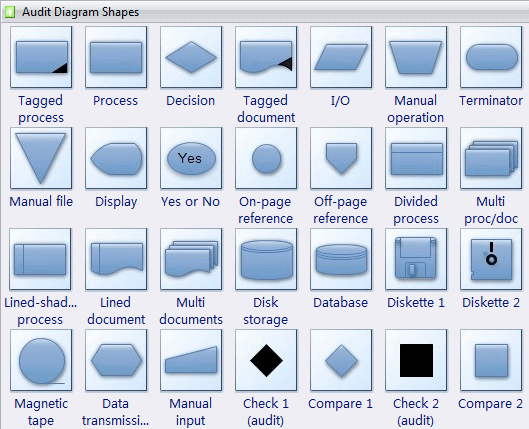
Audit Flowchart Shapes
The follow shapes is similar with the basic flowchart symbols but are specially used in the audit flowchart.
The Flowchart Symbols and Their Usage
Process represents a step in your process.

Predefined process indicate a set of steps that combine to create a sub-process that is defined elsewhere, often on another page of the same drawing.
Decision indicates a point where the outcome of a decision dictates the next step. There can be multiple outcomes, but often there are just two - yes and no.

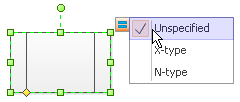
Terminal points indicate the starting and ending points of a process.


Data Shape Indicates that information is coming into the process from outside, or leaving the process.
Delay shape Represents a waiting period where no activity is done. In Process Mapping, delays are often important as they may result in adding to the cost of the product or simply delaying its production.

Database shape Use this shape for a step that results in information being stored.

Step represents a single step within a process, and usually contains the name of a specific action.
Page symbols refer to individual web pages, which may or may not contain multiple elements.
File symbols represent those data elements that exist independently of navigational properties outside of that page, e.g., audio sounds, movie clips, or a portable document file (PDF).
A decision point indicates a sequence in the process at which the end user chooses an option, i.e., a "yes-no", or "true-false" response, and then branches to different parts of the flowchart.
Arrows and connecting lines diagram the logical progression through the course, subject to the choices made at decision or action points within the process.
The input/action symbol represents a user response that directs the course flow from that point onwards, i.e., an online test, or questionnaire form.

Represents the choice made by the user from mutually exclusive options, e.g., a student choosing among different lesson plans.
Conditional selector is similar to the conditional branch except that the user has the option to choose from a number of paths that will fulfill the requested conditions, e.g., the results of a search engine request.
Pages that share one or more common aspects, and are functionally identical may be simplified as a rounded corner rectangle, such as an on-line test or feedback form.
Annotations provide helpful comments or explanations, e.g. denoting the location where an undeveloped new page/process will fit into the navigational flow structure, or notes for specific team members for further development.
Flow references and flow areas are symbols for reusable sequences, such as logging in with a specific user id and password to enter the course or to initiate an on-line quiz. The flow reference symbol acts as a placeholder for the flow area sequence in the chart in every situation in which it is repeated.
Flow area is used as a flow area, it documents sections that share similar components/repeated steps within that flow, and requires the use of the following two symbols: entry and exit points.
Exit point concludes the subroutine, such as when the proper user id and password are verified, and documents where the user re-enters the master flowchart.
Entry point documents the place within the master flowchart where the process deviates into a subroutine.
Reference is used as a connecting point when the flowchart necessitates using more than one page, or refers to a complicated subroutine that would be impossible to contain on the main flowchart page.
On-page reference Indicates that the next or previous step is somewhere else on the flowchart. It is particularly useful for large flowcharts.
Off-page reference Use the a set of hyperlinks between two pages of a flowchart or between a sub-process shape and a separate flowchart page that shows the steps in that sub-process.
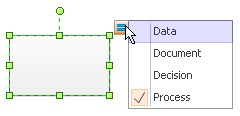
Flowchart Shapes The designers can click this multi-shape to set to any of the following shapes: Data, Document, Decision, or Process. Any text you type onto the shape, or information you add to its Shape Data, remains with the shape.
Document Represents a step that results in a document.

Process Flowchart Drawing Guide-lines
There is no one right way to develop a flowchart, but the following guide-lines provide a general structure to follow, whether it's of the overall course navigational process, or at the hand-off phase to the various team members to develop more detailed treatment.
- Start with a simple one-line description or title of the process being flowcharted , e.g., "How to..."
- Using a top-down hierarchy, start with a terminal symbol, naming this trigger event, e.g., "User accesses course database..."
- Connect each successive action step in the logical sequence of events.
- Reference detailed information through annotations or connectors.
- Follow the process through to completion, denoted by a labeled end terminal symbol, e.g., "exit course."
A well-developed functional flowchart created in the design phase can save hours of wasted manpower time by ensuring the structure, sequencing and branching decision points in a computer based instructional program, support the course goals and objectives before development.
Whether you are the sole creator wearing many hats, or one of many on the development team, sharing a common visual language will guide the project through its many iterations and development phases throughout the instructional design process.
Tidak ada komentar:
Posting Komentar